- Posted on: 2019-11-20
Reduce your debugging time with simple tools (3/3)
This is Part 3 of our 3-blog series.
Part 1 presented ideas to incrementally boost testing productivity. In Part 2, we went into detail on the system log suggestion and here, in Part 3, we go into detail on error reporting and error handling.
Systematically reporting and handling errors deliver real Productivity Gains when developing your ATS for an embedded product
The concept of ATS “error handling” covers two important topics:
Note: In a LabVIEW VI, the error cluster is the input and output area typically located at the bottom left and right corners.
- Reporting them so developers can improve the application and make the software more robust and simply let the operator know!
- Properly reacting and automatically recovering from errors needs to be done case by case, though they often fall into similar categories. In Symplify™, our approach is to use templates that enable addition of custom logic dependent on the error code and what that VI should do when that error occurs. The default behavior is either to simply “report and ignore” or to “send system to e-stop“. Another specific action may be to re-establish communication to a device.
The reporting part is easier to standardize, and should therefore be tackled very early on. Investing early in this building block will save a lot of time in the future, because having quick access to error information is crucial to accelerate your development by:
- Locating the root cause of problems, rather than a series of symptoms
- Knowing about problems before you otherwise find them, for example, “cannot create file on disk” or “command was not acknowledged by the loadbank“)
- Getting further information about what your code is trying to achieve, for example, “Requesting 200kS/s but the DAQ card can only sample at 51.2kS/s” or “the requested input range of 25V is not within the instrument’s limit of ±10V”
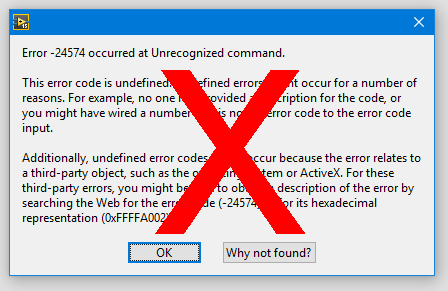
There are other benefits too, but these alone should justify spending some time in setting up something to log errors (in LabVIEW, more generally called ‘software exceptions’.) Do not rely on the “Automatic Error Handler” (our title image) as it is “blocking” and reports no information about the location in the code. As a Test Manager, simply ask your developers how those errors are handled or reported. If the answer is not satisfactory, It is likely well worth allocating some resources to address this problem.
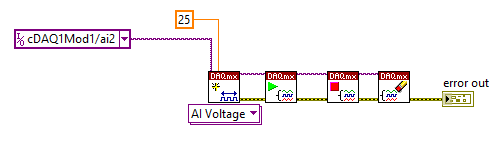
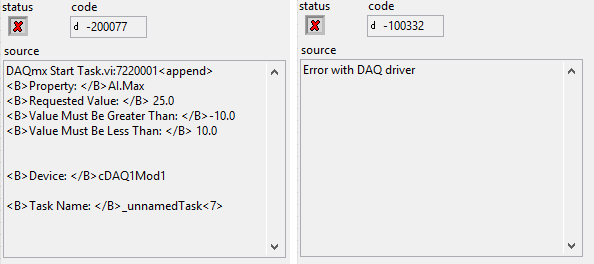
The code above would generate the below (on the left hand side) because NI DAQmx offers a lot of details in its error message to make your developers life easier. You can compare that to the error message on the right hand side that is often found in lower quality drivers.
Overcoming the first challenge
The first implementation often run into a universal problem where an error happening 20 times per second can quickly, and completely, fill up your system log (and possibly the disk space) without adding any value. A smarter, self monitoring application might adjust to report no more than “n” errors (say 20 by default) to the system log before ignoring that specific error.
Include a specific error location
As a final piece of advice, make sure to include date and time as well as the “call chain” information to quickly narrow down exactly where the error occured.
For example, this message:
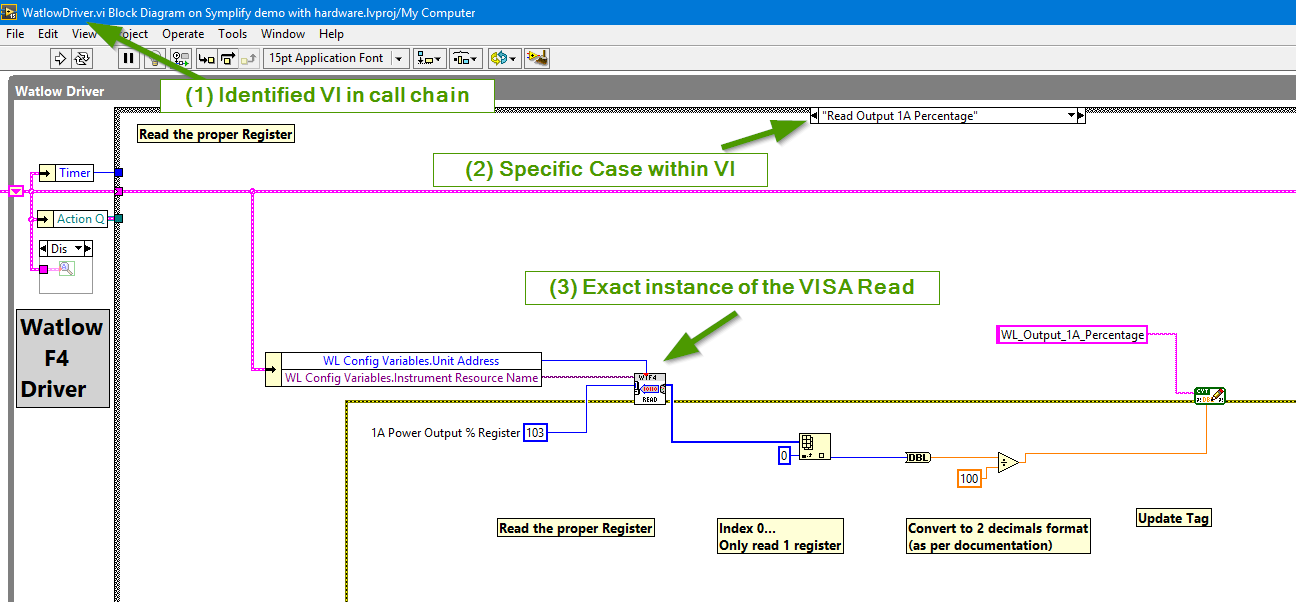
2019-09-04(Sun) @ 23:13:36 – Error -1073807339 –VISA Read in VAI Read.vi:5520001->Watlow F4.lvlib:Utility MODBUS RTU Receive Message.vi->Watlow F4.lvlib:Utility Read From Register.vi->WatlowDriver.vi (Count: 126)
Calling Chain: WatlowDriver.vi >> SYN Error Handler.lvlib:SYN Specific Error Handler.vi @Case ‘Read Output 1A Percentage’
Can quickly be traced to the associated code:
Conclusion: These concepts probably sound pretty simple but it’s surprising how often they are overlooked from the start, because of project time constraints, and never revisited later.
When we created Symplify™ we built these tools at the very beginning. Using them we were then able to save countless weeks of troubleshooting on our platform and for our clients. We estimate that we have saved at least 100x our initial investment in these tools in the 4 years we’ve been using them and year by year, they keep improving Symplify™’s users productivity.
This series of blog posts has focused on how to accelerate troubleshooting of LabVIEW based ATS but could equally apply to any other ATS. We recommend to:
- Call a meeting with your team and discuss these topics
- Question the rational if there is “not enough time to do things right…[but enough time to do them thrice…]
- Learn more about Symplify™ or request a demo
- Seek professional assistance from a National Instruments Alliance Partner