- Posted on: 2024-05-16
Problem: A typical ATS supports engineering R&D activities on many different instruments, and DUT (device under test) parameters that all need to be controlled and monitored. Identifying quickly what is happening when things don’t work is very valuable but difficult. When there is no error reported, you need to find what is wrong with the logic. The problem is how?
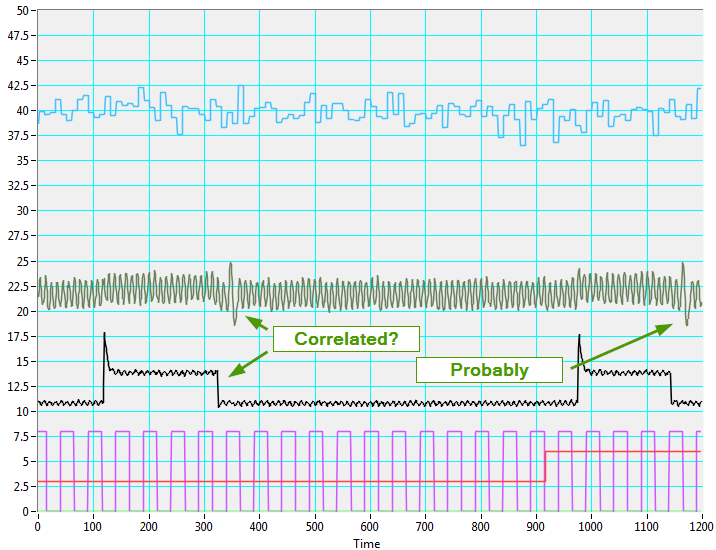
Solution: One of the best ways to understand what is happening in your ATS application is to visualize dozens of variables on a graph. Graphs with millions of data points displayed in real-time can immediately reveal data trends, interdependencies and deviations to greatly speed up problem resolution. Testing team managers need to ensure their teams can identify the root causes of problems quickly, or a lot of time and resources can be wasted troubleshooting especially as product complexity grows. Adding capabilities to your ATS such as flexible graphing increase productivity and can easily speed up by 10x (or more) your team’s troubleshooting and verification efforts.
How to start graphing? Collect the information then display it!
The simplest way is probably to include one or more LabVIEW “charts” directly into some of your “top-level VIs.” Create multiple tabs and charts to display more variables with different scales. But, as you can read in our blog post on parallel processing, multiple VIs must share variables values to gain a real edge in your analysis. As a starting point, we believe that 10k to 100k points is a reasonable “chart history length”.
How to improve this? Keep more data in memory!
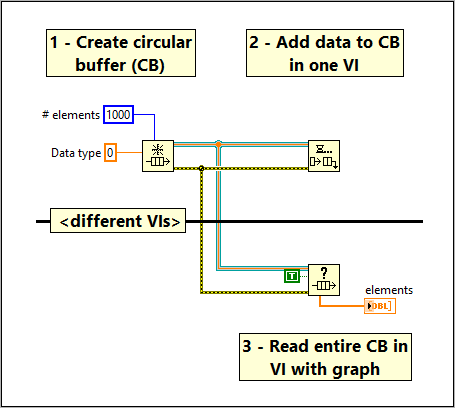
A “circular buffer” allocates a memory per variable to graph and overwrites oldest data after “n” hours.
One problem that many ATS face is that they only display and do not “store” the information as test values are read or received. As a result, you can only see the information on a graph after you select a specific signal, variable or tag rather than see what happened before you asked the question. The solution to this is to create a “circular buffer” to store the data at the time of test or simulation. There are various ways of implementing a circular buffer but one of the easiest in LabVIEW is to use a Fixed size Queue with a Lossy Enqueue.
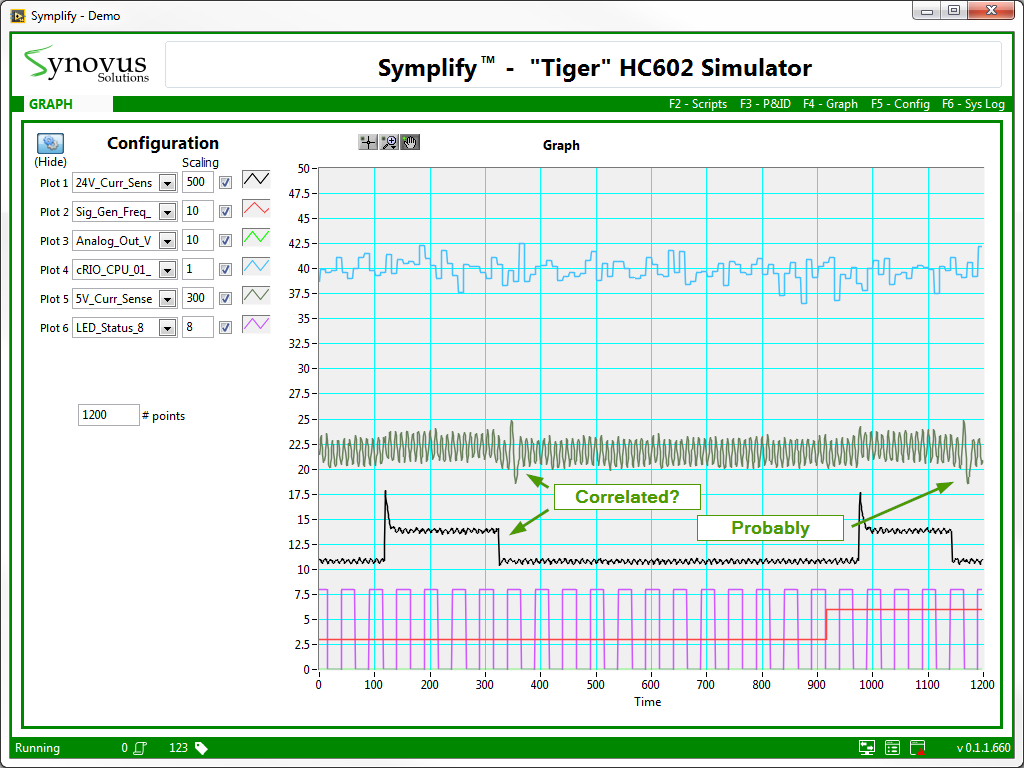
By using NI LabVIEW for your ATS, you may extend its functionality through your own software development or by using 3rd party developed applications to accelerate your embedded product development. Synovus Solutions Simplify™ product [link to Simplify page]is one such tool for increasing reliability, flexibility, scalability, repeatable results with comprehensive graphing. Symplify™ uses a circular buffer in RAM for the fastest graphing performance to handle thousands of variables recorded during your tests.
Even better: Stream to disk for future reference!
If accessing the data in “real-time” is not a requirement, continuously logging data to disk is great way to later have access to the data when you have a question, even if that’s days after the test was completed. LabVIEW users typically use TDMS (or CSV) file formats for storing and use NI DIAdem, an efficient post-processing measurement tool.
Even with this approach, the value of having all the data from across your application should not be under-estimated.
Conclusion: However your team chooses to implement graphing, start with the simplest approach that works. You know you can improve over time as your application evolves but do ensure that the approach supports the data access rates your application requires.
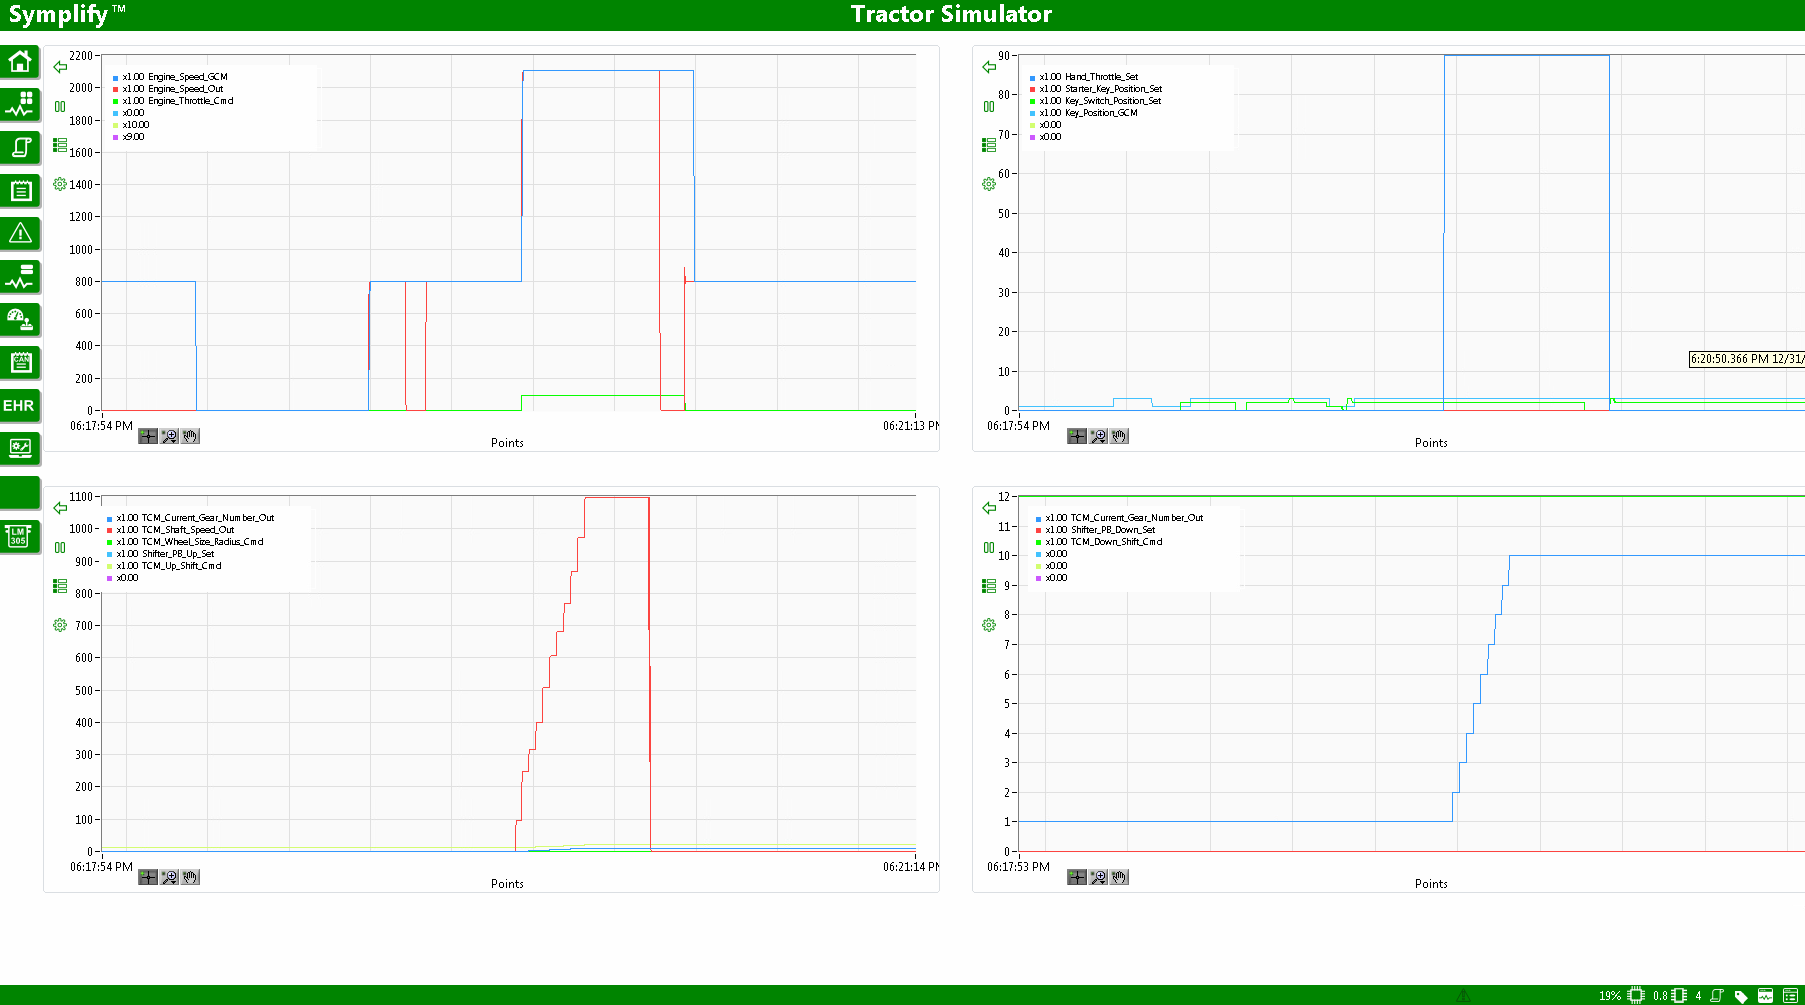
When we integrated the graph feature into Symplify™, we wanted to have the best of both worlds. We created a central location where all the variables (tags) would be read at a fast rate and stored in different circular buffers, at different rates. Therefore, you can see 100kS/s for a minute and multiple days at 1 point per minute. With such a range of options, Symplify™ enables fast and deep troubleshooting, typically leading to discovering problem root causes in 60 seconds, 24/7.
The ideas and implementation described here are specifically to troubleshoot LabVIEW based ATS for an embedded DUT with multiple equipment but the concept applies equally to any ATS.
Learn more about Symplify™ or request a demo.