- Posted on: 2022-04-20
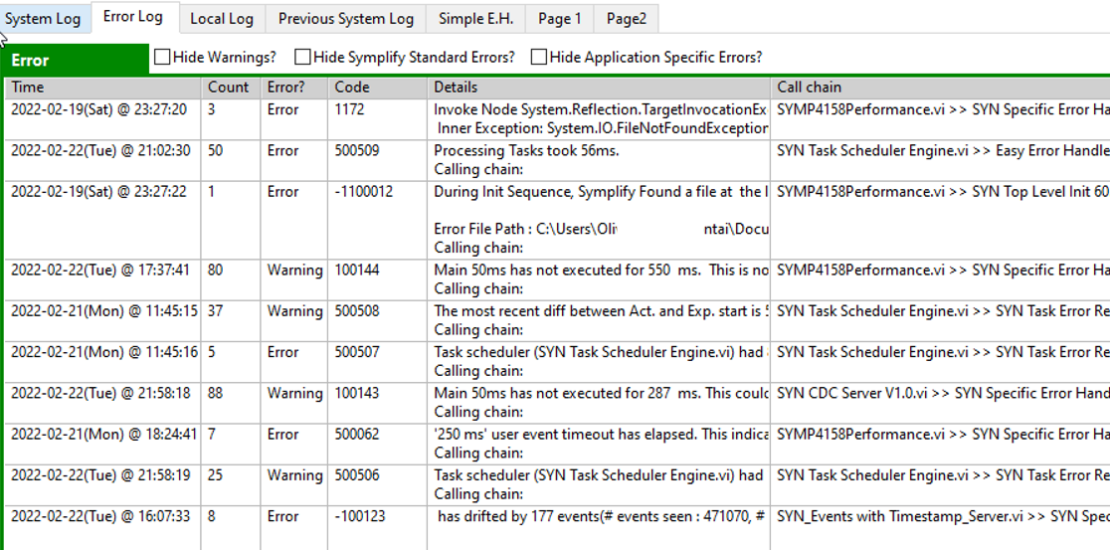
NI LabVIEW uses the error cluster to pass any software exception and other important notification along the dataflow paradigm. Symplify’s architecture makes it really easy to view and quickly identify the source of each of those errors. The following Error codes are the most frequently seen on standard Windows based PC. This list focuses on the performance monitoring aspect of the platform.
500506 and 500507
This is really the same problem reported but 500507 is treated as an Error while 500506 is treated as a warning. These codes mean that computer did not allocate time for the “Task scheduler” to do its task (normally done at 100Hz or every 10ms.) This happens every hour on a normal Windows machine and should typically not affect the performance of your ATE if it is fairly rare.
That error also implies that no other code module that is driven by the Task Events was “woken up” and could complete their work during that time period. Therefore, processing will not be done at 50ms (default) for some periods but the right number of triggers is guaranteed (Task scheduled recovers from late periods and maintain original phase.)
The default values are respectively 100ms and 250ms for the Warning and the Error but they can be modified. On a real-time (RT) system, the default values are typically 20 and 50ms. After all, Linux RT should be much better at allocating CPU time to a high priority process.
500062
This error is reported by specific VIs when the Event structure in the Idle case goes into the Timeout case. This only happens if a Task Scheduler event is not received within a timeframe of 5 periods (so 5x 50ms = 250ms typically.) This often happens in conjunction with 500507. You should not expect to see this more than a few times per day.
100143 and 100144
Unlike 500062 error that happens in the Event structure, 100143 and 100144 actually describe the code execution in your VI. If you see them frequently, it means that your code is taking a lot longer than the default allocated period (50ms). Most of the time, developers are not aware that their code is performing slowly but “determinism” is one of the two main causes of intermittent issues and challenges debugging LabVIEW application. Therefore, it makes sense to expose this as quickly as possible to the user.
Addressing the root cause
Some actions such as reading a value from a DMM can easily take 500ms so in that case, these errors would be expected. However, for typical applications, better performance is required. To resolve error 100143/144, simply navigate to the “Extra info” of your VI (or open Central Data Collector) and identify any case that is taking a sizeable portion of the total execution time for the VI.
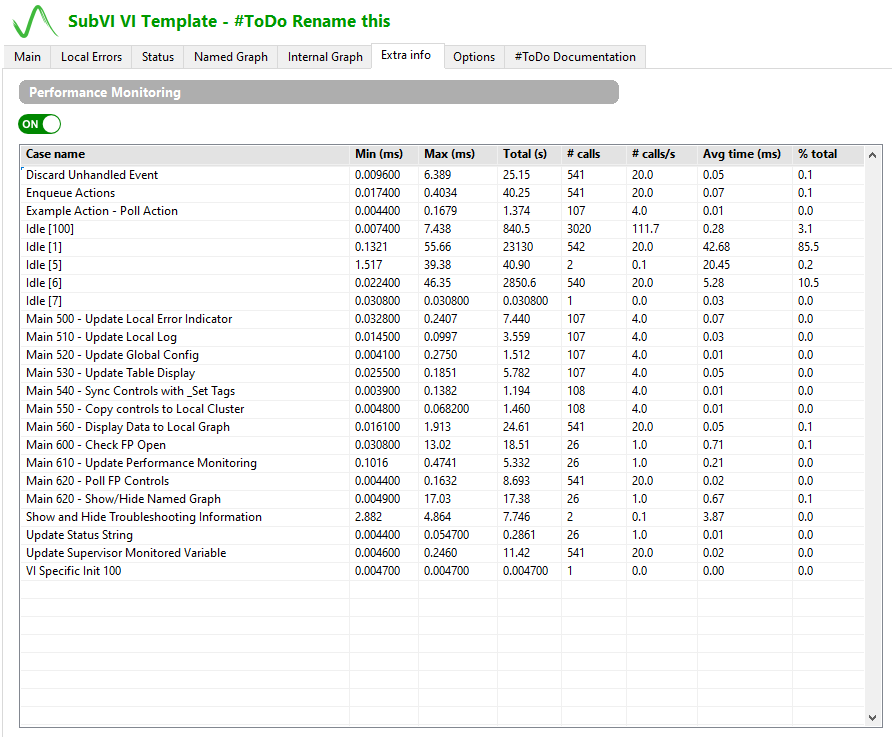
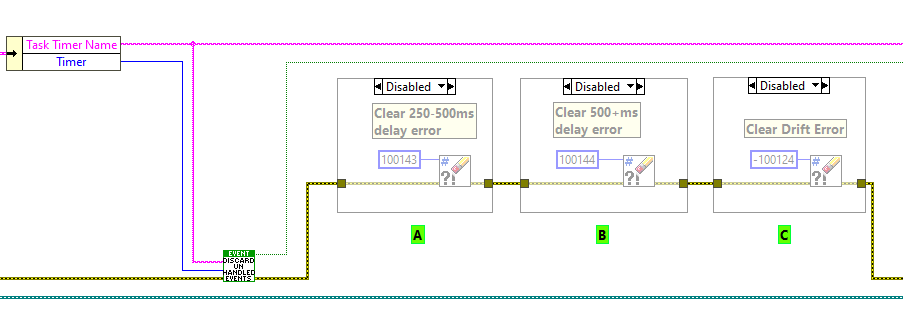
If Idle [1] reads 85% or more, it’s likely that you do not have any problem since the VI is mostly waiting for the next Task Scheduler User Event. You can then choose to remove those error codes in the case “Discard Unhandled Event” .
-100123
This is a very important error and unlike the other ones presented above, must be addressed by modifying your code. This is a built-in protection in the template to prevent a memory leak and an ever growing list of unprocessed User Events. In short, this error means that your code takes more than 100% of the time allocated to perform on an ongoing basis. It is only reported once the processing is 10 seconds behind the User Events that were last received so there is no concern if every now and then, for some reason, your code takes a few seconds to execute.
As this error will result in delayed activities and lack of responsiveness, it cannot be ignored (unlike what typically happens in custom code.) There are many potential solutions and our team of engineers would be happy to advise you on the best one for your application:
- Identify the portion of your code that is slow and improve it (see 100143)
- Simply reduce the frequency of your processing (4 times per second instead of 20)
- Parallelize the processing so more than one CPU core can be used
- Create a “helper loop” below the main loop of the template and let that loop complete slow tasks. The two loops can communicate through Queues, local variables or Tags.
We hope this help you understand some of the most common warnings and errors reported by a Symplify template in LabVIEW.