- Posted on: 2021-01-12
Foreword about our development philosophy
At Synovus, we train our engineers to use as few probes as possible when developing the LabVIEW code. That decision stems from our belief that it is usually faster to include any diagnostics information directly in the code as it is being created.
By proceeding that way, we force our developers to explain the code clearly as they create it, all the troubleshooting information while the code is running appears in context rather than as a single value but most importantly, every project gets some unexpected run-time behavior from time to time and having the diagnostic information available directly within the compiled code let’s us understand and fix issues in minutes rather than weeks.
By using our tools, we know that this extra logic has minimal impact on the performance of the application (CPU and RAM.)
The exceptions and where smart probes from Saphir come in
There are always some exceptions to this general guideline and when we need them, our developers like to rely on the probes [name] created by Saphir some time ago. Let’s take a look at a few of them below.
Please note that you need to install a package that is not in the basic LabVIEW installation to access the features below.
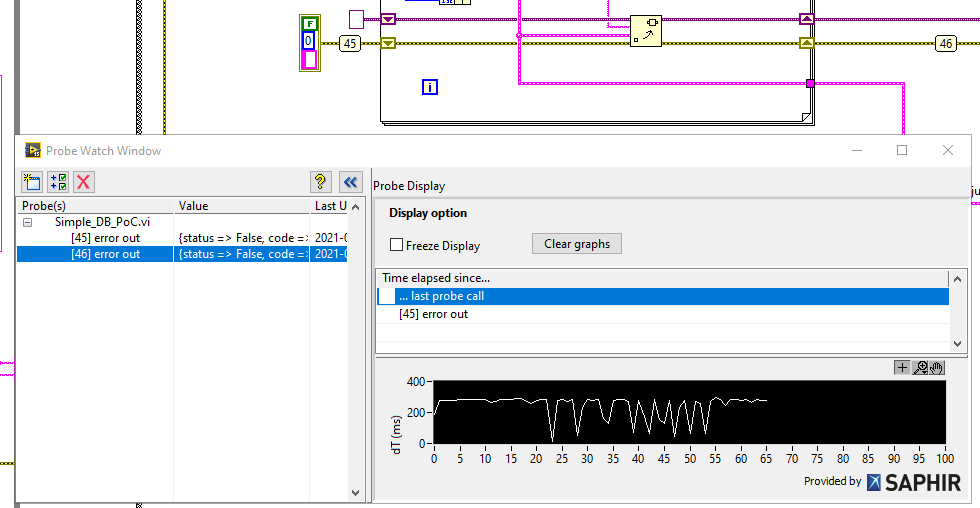
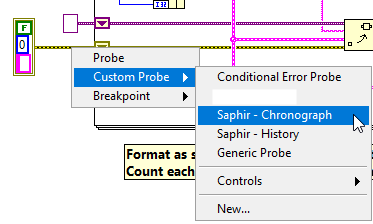
Saphir Chronograph
This probe quickly let’s a developer measure the execution time, in milliseconds, between two locations in the code. The fastest way to access it is to right click on a Error cluster wire and select it from the menu:
If you place more than one such probes, you will have the option to select the time since the last call (i.e. how deterministic is your code at repeating an operation) and the time since calling another similar probe elsewhere in your code, as can be seen on the image below:
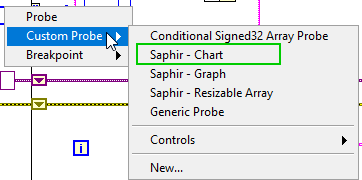
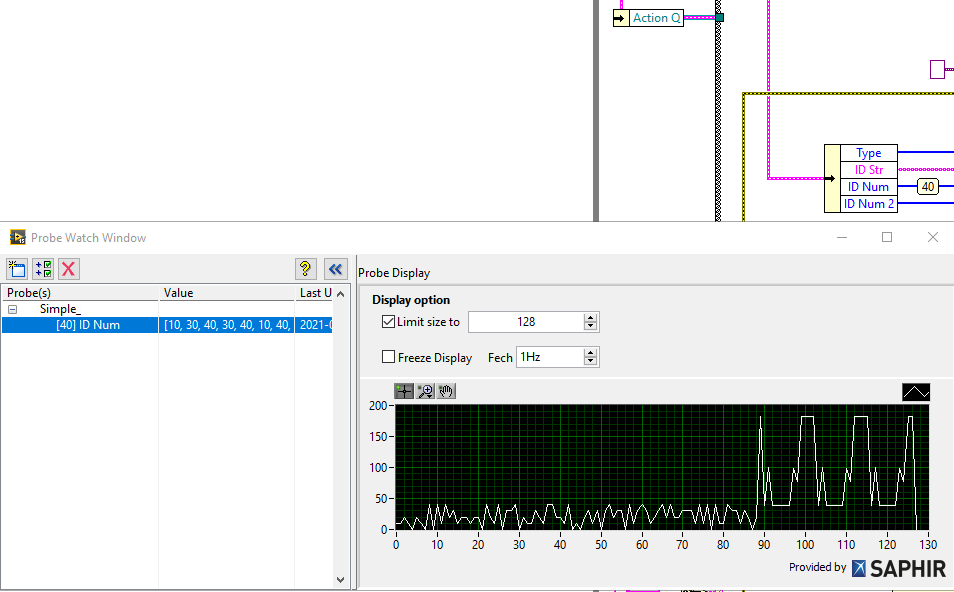
Saphir Chart
Another useful application of probes is to display a large number of data points that is difficult to grasp on a typical numeric indicator. It should be available if you right-click on any numerical type of data.
Each time the code underneath the probe is executed, it will add a new point to the chart so if your code executes 20 times per second, you can easily monitor all those data points for patterns and outliers.
Saphir Graph
The graph probe can be used to represent an array of numerical data. Rather than looking at a lot of distinct numbers, as you can see on the image below, it is possible to visualize many values on a graph. This is useful to quickly find a discontinuity in a sequence or a change in the general pattern as can be seen below.
Useful links:
• Saphir probes: http://sine.ni.com/nips/cds/view/p/lang/en/nid/209756
• Here is a starting point for custom probes: https://zone.ni.com/reference/en-XX/help/371361R-01/lvhowto/creating_custom_probes/